
"If man's wit be wandering, let him study the mathematics..."
Northeastern Gulf of Mexico Surface Circulation
The movies below show the surface circulation for 15 Mar - 24 Apr 2007, with color-contoured thermodynamic properties (temperature and salinity). Data is output from a ROMS model configured for the northeastern Gulf of Mexico, and does NOT include tides. These movies are intended only as an educational tool for the Marine Field Methods course by Dr. Kevin Speer at FSU during Spring 2009, and are not intended to be used for other purposes. Any questions can me directed to me at: todd {at} coaps.fsu.edu
Circulation with TEMP:
Circulation with SALINITY:
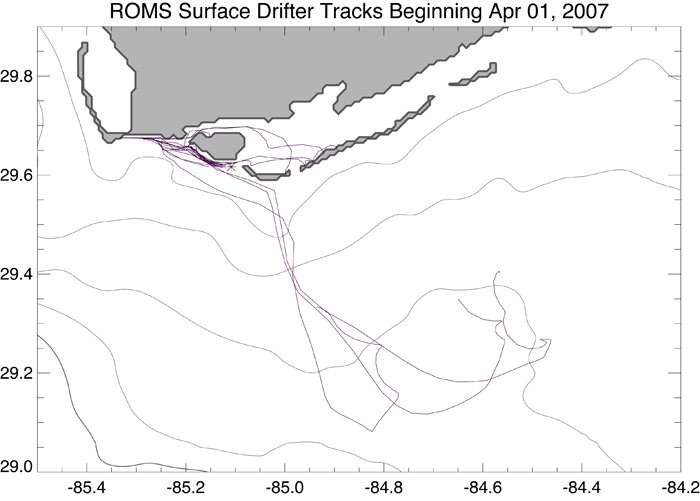
Partile Trajectories
16 particles are seeded every 3 hours over the course of two days, just gulside of West Pass. Then, from the time each particle is seeded, it is followed for 10 days as it is advected around in the surface shelf circulation. The same model configuration as above is used, and this plot shows the trajectories of these each particle. Position data may be downloaded here and is an ascii file with output as (particle, lon, lat):
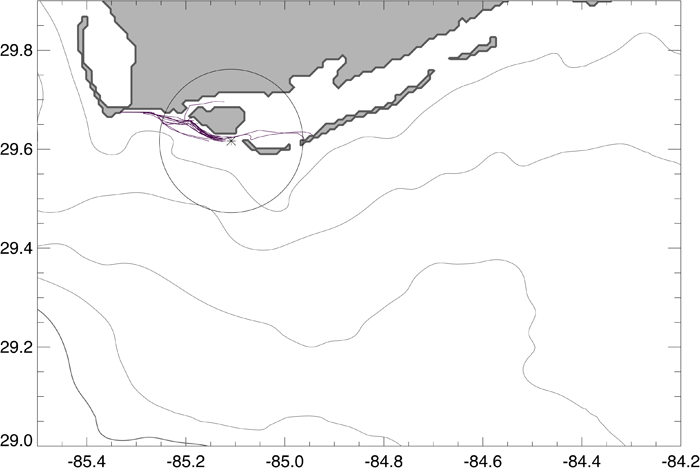
Same number of particles, but they are only followed for 48 hours each. The circle represents a 10-mile radius from the seeding location in order to simulate an estimate of the line-of-sight of the ship's radar.
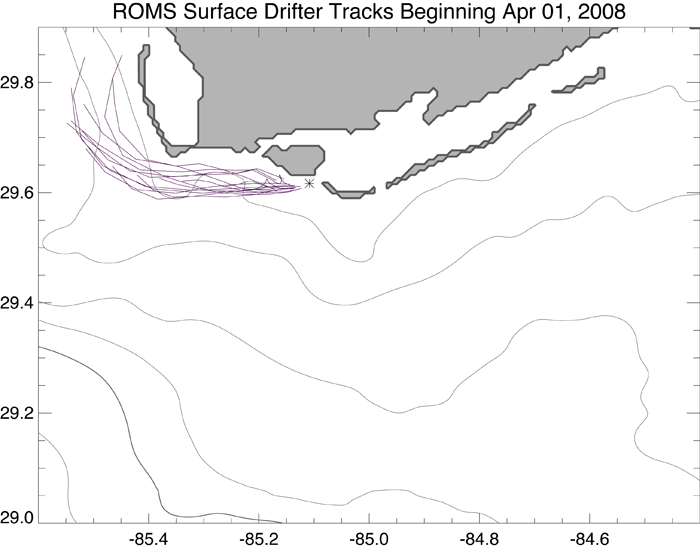
Again, the same number of particles, but this time they are only followed for only 24 hours each in the year 2008. Notice the larger distance covered by these particles, although over a shorter time period.
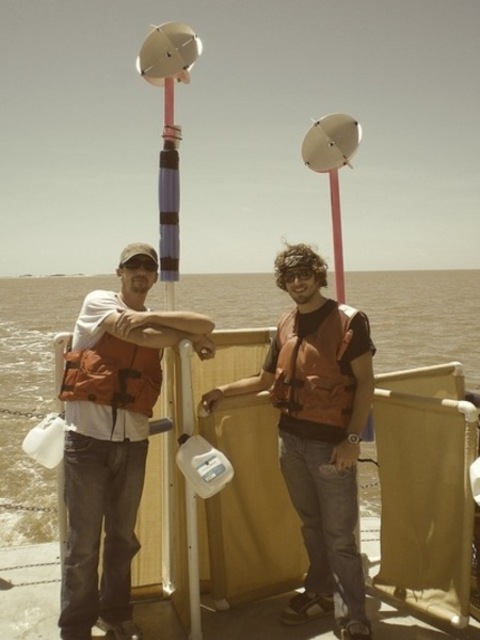
Bryan Rahter and me with our low-cost surface drifers onboard the R/V Bellows.
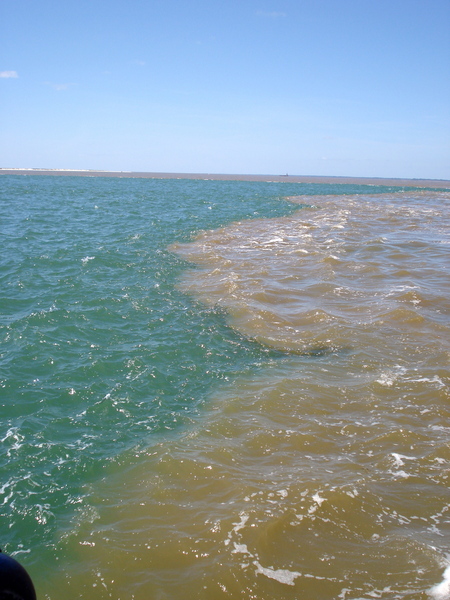
Extreme horizontal stratification just outside East Pass in Apalachicola Bay, due to intense flooding of the Apalachicola River. Salinities ranged from <5 ppt on the right side of picture to ~20 ppt on the left of the picture. In the region of the salinity front, salinities were confined to a thin (<1m) layer.