 Brief Overview
Initial analysis compared R/V fluxes to those derived by the first NCEP/NCAR reanalysis:
For full results and methods see:
Smith, Shawn R., David M. Legler, and Kathleen V. Verzone, 2001: Quantifying Uncertainties in NCEP Reanalysis Using High-Quality Research Vessel Observations. J. Climate,14 , 4062-4072.
 Brief Overview
The uncertainties in the NCEP/NCAR reanalysis (NCEPR) products are not well known. Using high resolution, quality controlled, surface meteorology data from research vessels participating in the World Ocean Circulation Experiment (WOCE), regional and global uncertainties are quantified for the NCEPR air-sea fluxes and the component fields used to create those fluxes.
 Methods
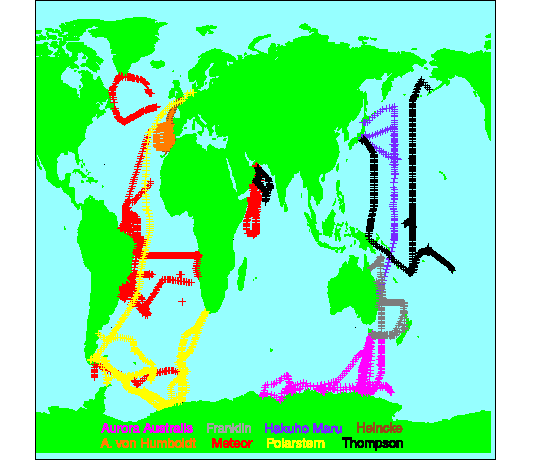
For the period 1990 through 1995, WOCE vessel and gridded NCEPR fields are matched in time and space. All in-situ data are subject to data quality review to remove suspect data. Adjustment of ship observations to the reference height of the NCEPR variables, and calculation of air-sea fluxes from the in-situ data are accomplished using bulk formulae that take atmospheric stability, height of the measurements, and other adjustments into consideration. The advantages of using this new set of WOCE ship observations include the ability to compare 6-hour integrated fluxes (much of the ship data originate from automated observing systems recording continual measurements), and the ability to perform more exhaustive quality-control on these measurements. Over 4500 6-hourly component (sea-level pressure, air and sea temperature, winds, and specific humidity) and flux (latent, sensible, and momentum) matches (Fig. 1) are statistically evaluated to quantify uncertainties between the ship observations and the NCEPR.
 |
 Results
Primary results include a significant underestimation in NCEPR near-surface wind speed at all latitudes (Fig. 2b). The magnitude of the low bias increases at higher ship wind speeds (Fig. 3a) and may be related to large (rms = 2.7 hPa) errors in sea-level atmospheric pressure over the entire globe. The pressure biases show the NCEPR to underestimate the amplitude and/or position of both high and low pressures (Fig. 2a, 3b). The NCEPR slightly underestimates the momentum flux (Fig. 4a), in part, due to the weaker winds. The NCEPR sensible and latent heat fluxes are largely overestimated when compared to the WOCE ship data (Fig. 4b,c). The overestimation of sensible and latent heat fluxes is counter-intuitive in the light of the weak NCEPR winds. The authors analysis and previous works suggest that the weak winds are offset by parameterization effects (including unusually large temperature and humidity roughness lengths at moderate and high wind speeds in the NCEPR parameterization).
Fig.2: Mean (a) sea-level pressure and (b) wind speed for paired WOCE ship (red) and NCEPR (blue) observations averaged in 20 degree latitude bins. Standard error for the ship and NCEPR values in each latitude bin are noted with bold and thin error bars, respectively. Tick marks on the x-axis denote the center of the latitude bin represented by labels on either side of the tick.
Fig.3: (a) Wind speed bias (NCEPR - WOCE ship) averaged in 2.5 ms-1 bins of wind speed reported by the research vessel, and (b) sea-level pressure bias (NCEPR - WOCE ship) averaged in 10 hPa bins of pressure reported by the research vessel. Biases are plotted at the center of pressure bins. A standard error for the biases in each bin is plotted with an error bar on the mean bias. Fig.4: Mean (a) momentum, (b) sensible heat, and (c) latent heat flux for paired six-hourly WOCE ship (red ) and NCEPR (blue) observations averaged in 20 degree latitude bins. Standard error for the ship and NCEPR values in each latitude bin are noted with bold and thin error bars, respectively. Tick marks on the x-axis denote the center of the latitude bin represented by labels on either side of the tick.
Some of the parameterization effects are revealed using the NCEPR meteorological variables and an independent flux parameterization. The revised NCEPR/S sensible heat fluxes are closer to the observations, and the biases of the revised NCEPR/S latent heat flux change sign. Furthermore, while the revised latent heat flux values reduce the magnitude of the bias at higher wind speeds, they increase the bias at (more frequently occurring) moderate wind speeds and thus may not be suitable for many applications (Fig. 5).
Fig.5: Latent heat flux bias for NCEPR - WOCE ship (triangles) and NCEPR/S - WOCE ship (circles). Biases are averaged in one meter per second bins of NCEPR wind speed. Biases are plotted at the center of the wind speed bins. A standard error for the biases in each bin is plotted with an error bar on the mean bias.