This report summarizes the quality of
multimet automated weather system (AWS) data on the Discovery (identifier:
GLNE) during one WOCE cruise between 22 December 1992 and 31 January 1993.
The data were provided to the Florida State University Data Assembly
Center (DAC) in electronic format by D. Turner of the British
Oceanographic Data Center. They were converted to standard DAC netCDF
format. The data were then processed using an automated screening program
which adds quality control flags to the data, highlighting potential
problems. Finally, the Data Quality Evaluator reviews the data and
current flags. Flags are then added, modified, and deleted according to
the judgment of the Data Quality Evaluator and other DAC personnel. An
in depth description of the WOCE quality control procedures can be found
in Smith et al. (1996). The data quality control report summarizes all
flags for the Discovery multimet AWS data and explains reasons why these
flags were assigned.
Statistical Information:
The Discovery multimet AWS data are expected to include observations taken every minute on the WOCE cruise. Values for the following variables were collected:
| Time | (TIME) |
| Latitude | (LAT) |
| Longitude | (LON) |
| Earth Relative Wind Direction | (DIR) |
| Earth Relative Wind Speed | (SPD) |
| Air Temperature | (T) |
| Wet Bulb Temperature | (TW) |
| Longwave Atmospheric Radiation | (RAD) |
| Shortwave Atmospheric Radiation | (RAD2) |
| Pressure | (P) |
| Photosynthetically Active Radiation | (RAD3) |
Details of the cruise including dates, number of records, number of
values, number of flags, and percentage flagged are listed in Table 1. A
total of 623,700 values are evaluated with 2136 flags added by the
preprocessor and Data Quality Evaluator for a total of 0.34 percent of the
values being flagged.
| CTC | Dates | Number of Records | Number of Values | Number of Flags | Percentage Flagged |
| A__11_/00 | 22 Dec 92 - 31 Jan 93 | 56700 | 623,700 | 2136 | 0.34 |
The multimet AWS from the Discovery are in excellent condition with
only 0.34 percent of the data being flagged for errors. Table 2 provides
the numbers and percentage of flags for each variable. A thorough
discussion of the flags follows.
| Variable | B | G | K | Q | S | Total Number of Flags | Percentage of Variable Flagged |
| DIR | 550 | 226 | 17 | 793 | 1.40 | ||
| SPD | 281 | 12 | 293 | 0.52 | |||
| T RAD RAD2 P RAD3 | 22 | 947 | 12 21 | 12 16 | 6 9 2 3 | 18 59 23 947 3 | 0.03 0.10 0.04 1.67 0.01 |
| Total number of Flags | 22 | 1497 | 33 | 535 | 49 | 2136 | 0.34 |
| Percentage of All Values Flagged | 0.00* | 0.24 | 0.01 | 0.09 | 0.01 | 0.34 |
Value
Out of Realistic Range ("B" flags)
"B" Flags were
administered to the longwave atmospheric radiation data by the
preprocessor. The flags identify values that are less than 0 Watts per
meter squared or greater than 1400 Watts per meter squared.
Value Greater Than 4 Standard Deviations from Climatology ("G" flags)
The
preprocessor bestowed "G" flags upon earth relative wind direction data
and pressure data. The flags identify values that are greater than 4
standard deviations from the Da Silva (1994) climatology for each
parameter. This test does not necessarily indicate erroneous values, just
extreme data.
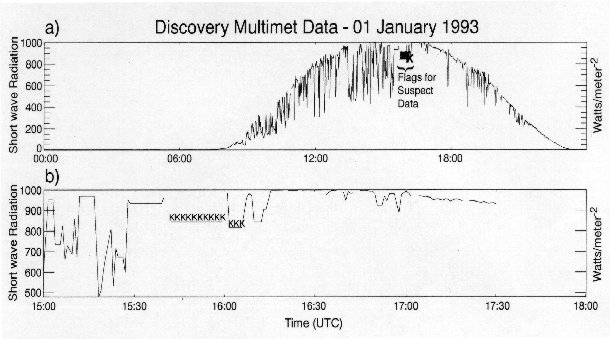
Data Suspect ("K" flags)
The Data Quality
Evaluator assigned "K" flags to shortwave atmospheric radiation. The
flags identify values that are of questionable quality. In Figure 1a the
graph of shortwave atmospheric radiation is shown for 1 January 1993 from
00:00 through 24:00 UTC with a small portion of the graph being flagged
between 12:00 and 18:00 UTC. Figure 1b, a zoom of the data from 15:00 to
18:00 UTC, highlights the position of the flagged data. Note that the
graph becomes displaced and has constant values between 15:30 and 16:30
UTC indicating unrealistic values of shortwave atmospheric radiation.
Figure 1: a) Shortwave radiation for 1 January 1993 with a region of suspect data highlighted. b) A zoom of the suspect region from 15:00 to 18:00 UTC. "K" flags mark the suspect data.
"Q" flags represent values that arrived at the DAC already flagged as suspect. No reason for these suspect values was provided to the DAC; however, the flags were retained in our format. The data should be used with caution.
Spike in the Data ("S" flags)
The Data Quality
Evaluator applied "S" flags to various parameters. The flags indicate
areas in the data that are drastically out of the current data trend.
Spikes are common to electronic data and may be associated with power
surges that briefly disrupt the electronic integrity of the multimet AWS
systems.
Final Comments:
The Discovery multimet AWS data is of excellent quality and should be very reliable for the user.
References:
da Silva, A. M., C. C. Young and S. Levitus, 1994: Atlas of Surface Marine Data 1994, Volume 1: Algorithms and Procedures. NOAA Atlas Series. In preparation.
Smith, S. R., C. Harvey, and D. M. Legler, 1996: Handbook
of Quality Control Procedures and Methods for Surface Meteorology Data.
WOCE Report No. 141/96, Report WOCEMET 96-1, Center for Ocean Atmospheric
Prediction Studies, Florida State University, Tallahassee, FL 32301