 |
 |
 |
|
|
|
(A brief synopsis, full manuscript submitted to Journal of Geophysical Research, (Oceans))
David F. Zierden, Mark A. Bourassa, and James J. O'Brien
Abstract. Two extratropical marine cyclones and their associated frontal features are examined by computing surface pressure fields from NASA Scatterometer winds. A variational method solves for a new surface pressure field by blending high resolution (25 km) vorticity computed along the satellite track with an initial geostrophic vorticity field. Employing this method with each successive pass of the satellite over the study area allows this surface pressure field to evolve as dictated by the vorticity patterns computed from NSCAT winds. The result is a high resolution surface pressure field that captures features such as fronts and low pressure centers in more detail than NCEP reanalyses. The NSCAT surface pressure fields prove to be nearly as accurate as NCEP reanalyses when compared to ship and bouy observations; which is an encouraging result given that NCEP reanalyses incorporate a myriad of data sources and the NSCAT fields rely primarily on one source. In addition, the high resolution vorticity fields computed from NSCAT winds reveal the location of surface fronts in great detail. These fronts are verified using NCEP analyses, in situ data, and satellite imagery.
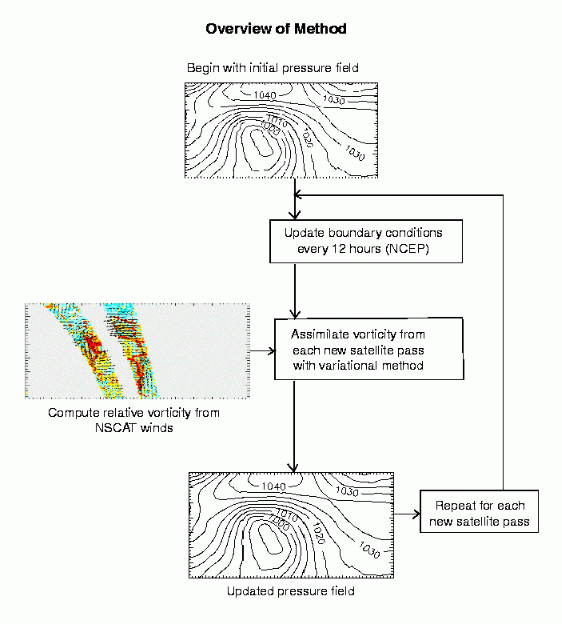
The technique developed in this study builds on the strengths of Brown and Zeng [1994] and incorporates the variational method of Harlan and O'Brien [1986]. The procedure begins with and NCEP mean sea level pressure field. For each pass of the satellite over the study area, the duo swaths of NSCAT wind data are assimilated into the pressure field. Although surface pressure and winds are physically different data types, they are related through vorticity. Relative vorticity is computed in the swaths from NSCAT winds using centered finite differences. Geostrophic vorticity is computed using the Laplacian of the initial pressure field. A variational method solves for a new surface pressure field, minimizing the difference between the new geostrophic vorticity and NSCAT vorticity where satellite data are present, and minimizing the difference between the new geostrophic vorticity and old geostrophic vorticity where no satellite data are present. The result is an updated pressure field that captures the features found in the NSCAT data. Repeating this procedure with each new pass of the satellite over the domain allows the field to evolve in time as dictated by NSCAT data.
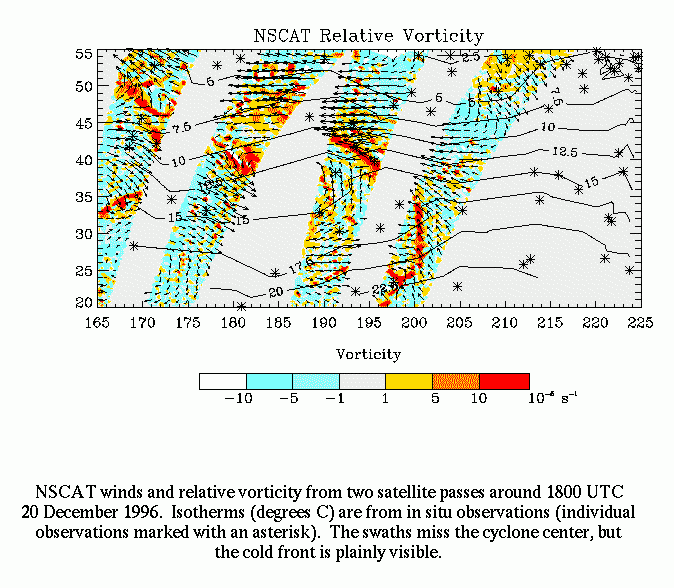
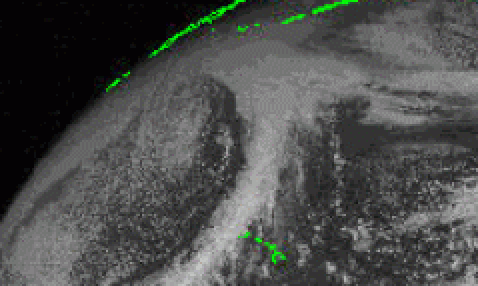
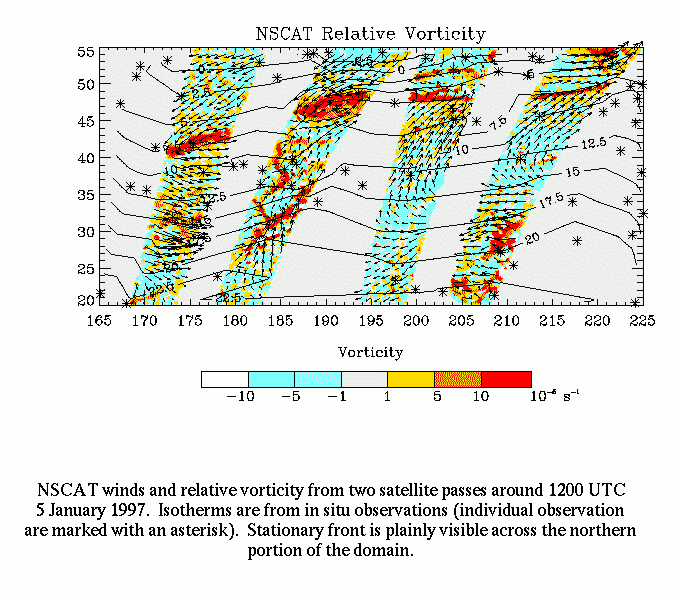
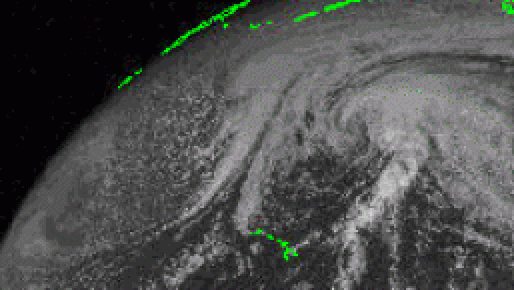
Locating fronts and other surface features over the ocean using satellite remote sensing has been a subject of great interest. Fronts can be seen in the NSCAT wind vectors as sharp changes in wind speed and direction. However, these changes are often subtle, making the identification and exact location of the fronts difficult to determine. On the other hand, even subtle changes in wind speed and direction lead to well-defined features in the NSCAT relative vorticity fields. Below are two examples of fronts as identified in the NSCAT relative vorticity fields. NSCAT wind vectors and isotherms from in situ observations are also plotted to verify these features as fronts. Visible GOES-8 imagery also verifies the presence of a front.
(Click on each image to enlarge)
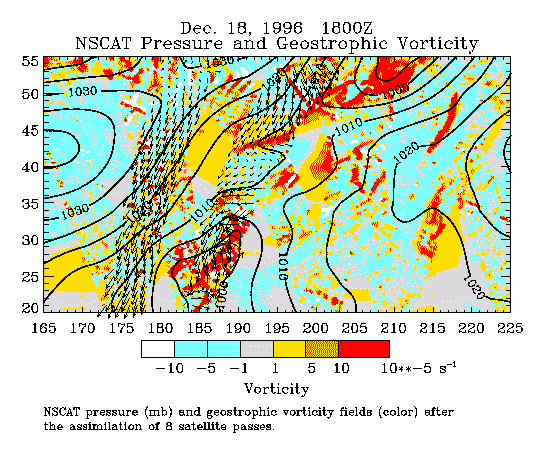
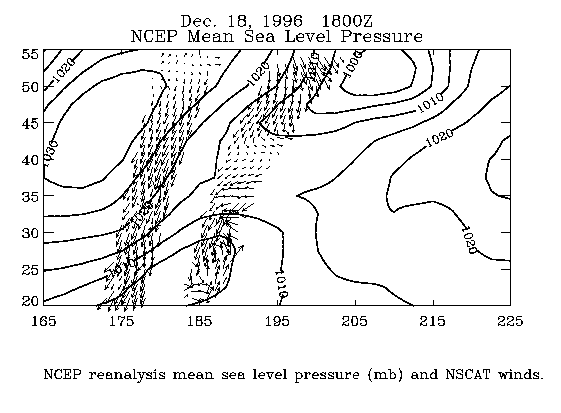
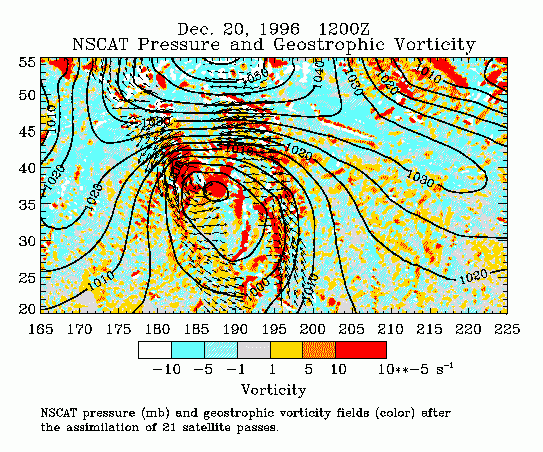
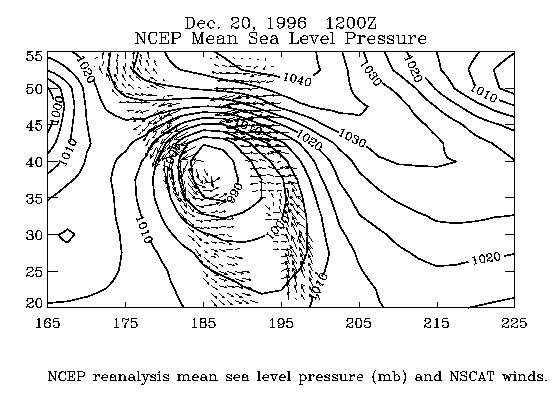
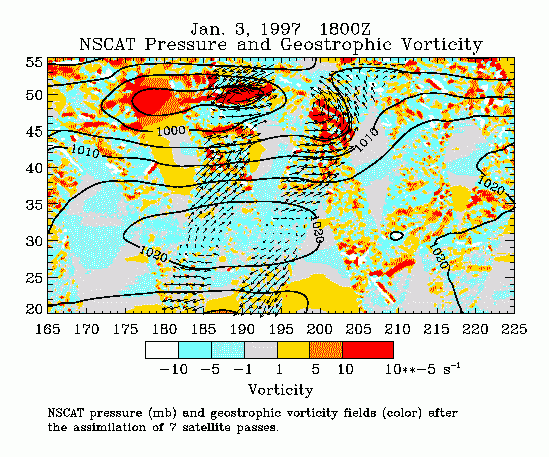
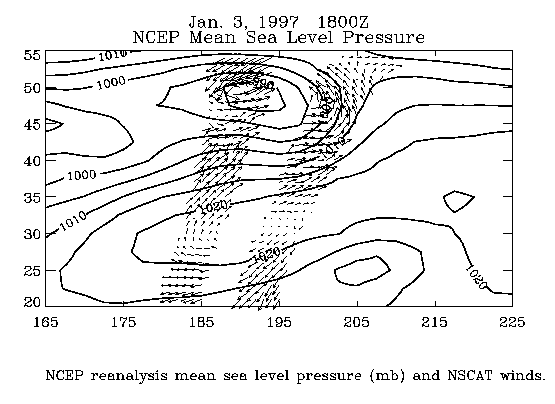
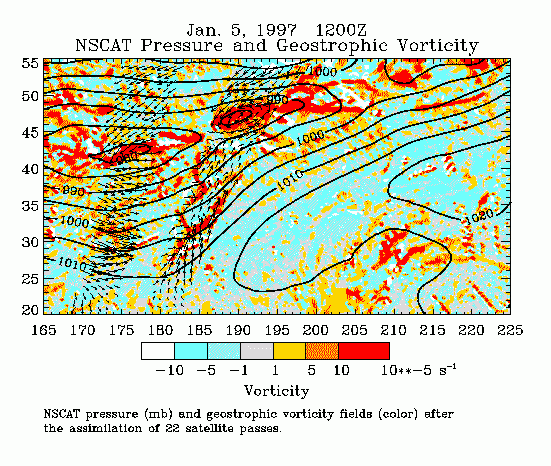
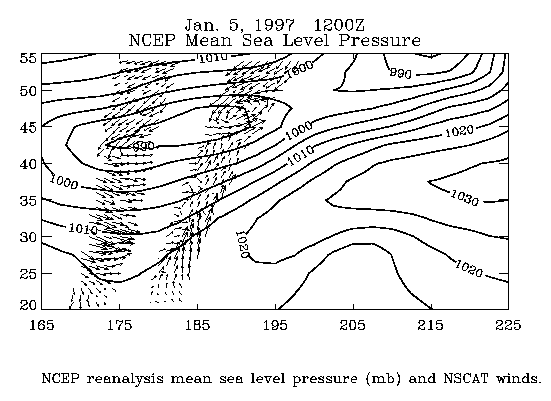
The variational method is used to follow the evolution of two synoptic scale systems over the north Pacific. The first is a case of explosive cylogenesis and the second is a case of frontogenesis. The continued assimilation of successive satellite passes over the course of several days allows the surface pressure fields to evolve over the life of these two systems. Two snapshots of the NSCAT surface pressure fields from each case are presented below. The background geostrophic relative vorticity fields are also plotted in color-filled contours to demonstrate the effectiveness of the variational method in blending in NSCAT relative vorticity. NCEP reanalysis mean sea level pressure fields are also shown for comparison.
(click on each image to enlarge)
Surface features such as fronts and low pressure centers are clearly identified in relative vorticity fields computed in the swaths of NSCAT wind data. By assimilating the swath relative vorticity with ambient geostrophic vorticity using a variational method, an updated surface pressure field can be obtained that captures the features resolved in the NSCAT swath vorticity fields. The new NSCAT pressure fields locate low pressure centers and fronts more accurately and with greater detail tha NCEP reanalyses. Overall, the NSCAT surface pressure fields are nearly as accurate as NCEP reanalyses when compared to in situ data. NSCAT had a mean differences of 0.2 to 2.4 mb. and standard deviations less than 6.1 mb., while NCEP mean differences were 0.0 to 1.2 mb. and standard deviations were less than 5.8 mb. This study demonstrates how accurate surface pressures can be derived from scatterometer winds. It is hoped that the derived surface pressure fields will prove a better vehicle for the assimilation of scatterometer data into NWP models [Atlas, 1997].
Atlas,R., Atmospheric observations and experiments to assess their usefulness in data assimilation, Journ. Meteor. Soc. Japan, 75, 111-130, 1997.
Brown, R. A., and L. Zeng, Estimating central pressures of oceanic midlatitude cyclones, J. Appl. Meteor., 33, 1088-1095, 1994.
Harlan, J. Jr., and J. J. O'Brien, Assimilation of scatterometer winds into surface pressure fields using a variational method, J. Geophys. Res., 98, 10233-10244, 1993.
