
Temperature Data
Many models exist for global surface temperature anomaly or global SST anomalies. According to the staff at the NOAA Paleoclimate Data Center, temperature is difficult to reconstruct and the many available models have their own strengths and weaknesses (personnel communication, 2012). However, Michael Mann's global surface temperature anomaly reconstruction16 is considered one of the premier paleoclimate temperature anomaly models. Mann's study grids surface temperature anomaly globally at 950 to 1250 A.D. and 1400 to 1700 A.D. The surface temperature anomalies in this study are defined relative to the 1961–1990 reference period mean. It also contains a time series that has decadal surface temperature anomaly averaged over the Northern Hemisphere and SST anomaly averaged over the North Atlantic AMO (Atlantic Multidecadal Oscillation) region.
http://www.ncdc.noaa.gov/paleo/pubs/mann2009b/mann2009b.html
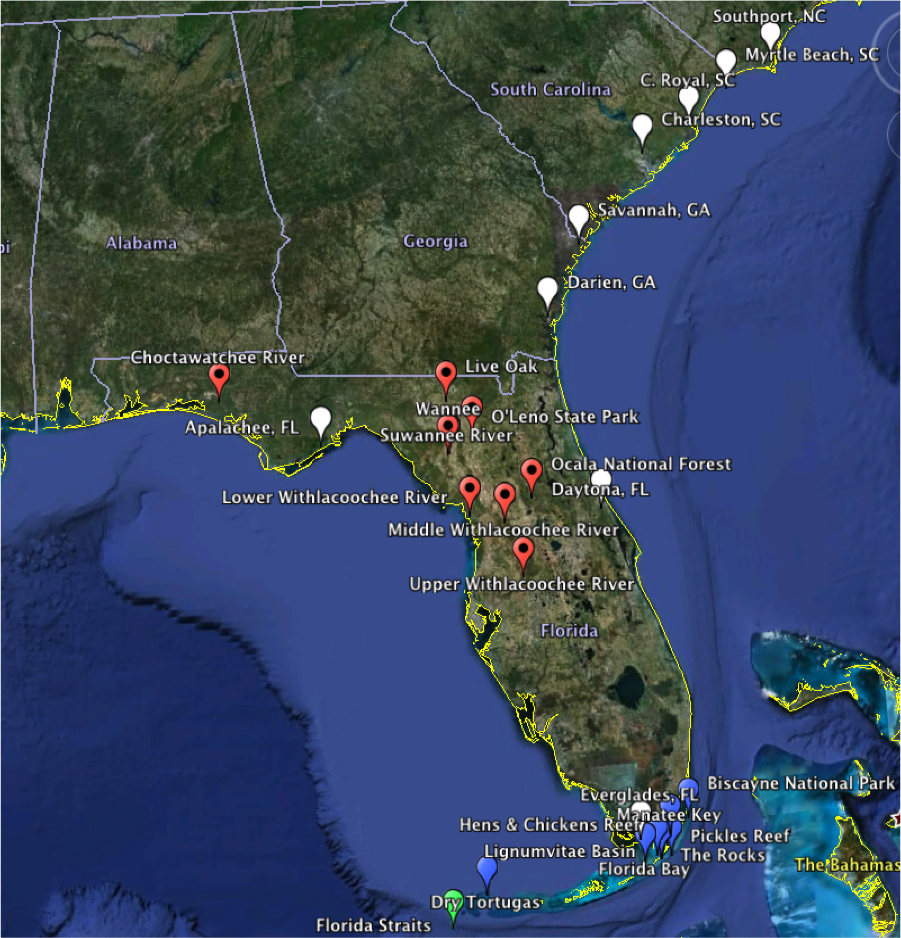
Map displaying proxy locations relevant to the state of Florida. These proxies include coral1 (blue), tree ring (red), shoreline7 (white), and planktonic foraminifera8 (green). The coral and tree ring are mainly colonial era data, whereas shoreline and planktonic foraminifera are paleoclimate data.