
 Dr. Xiaobiao Xu
Principal Investigator
Ocean circulation regulates the Earth’s climate by transporting heat and carbon through the global ocean and storing heat and carbon in the deep ocean. In the Southern Ocean, the strongest current on earth, the Antarctic Circumpolar Current (ACC), distributes heat, salt/ freshwater, and carbon between ocean basins. Near the sea surface the strong westerly winds drive Ekman transport equatorward. However, throughout most of the water column, in which mean currents flow along the fronts, the ACC presents a major barrier to meridional transfers. Theory, numerical models, and sparse observations point to mesoscale eddies and standing meanders of the ACC as the primary drivers of meridional fluxes within most of the water column. The interaction of the ACC and the complex topography of the Southern Ocean concentrates cross-frontal exchange locally in a handful of locations – so called ‘hot spots’ (Thompson and Sallee, 2012). Hot spots occur where ACC fronts converge and diverge as they navigate topographic ridges and obstructions (Sokolov and Rintoul, 2009). Dynamical processes drive strong mesoscale eddy variability there in eddy-mean interaction with steering and blocking topography. The ensuing standing meanders in frontal paths produce along- isopycnal poleward heat flux. Poleward isopycnal exchange along the sloping thermocline drives upwelling (Tamsitt et al., 2018). Notable warming occurs downstream of the cross-frontal injection sites, indicative of watermass modification along the ACC path (i.e., occurring at mid- depths away from direct atmospheric forcing) (Watts et al., 2018). Exchange across the full ACC width occurs as a hand-off of heat from one front to neighboring front at successive along stream sites, allowing the heat to follow a spiral path southward (Foppert et al., 2017; Tamsitt et al., 2017). The Southern ACC Front (SACCF) presents the final barrier to heat and tracers crossing poleward. Hence its heat and carbon fluxes are of particular interest because they directly influence Southern Ocean gyres like the Ross Sea, Weddell Sea, and Antarctic slopes (Rintoul and Naveira Garabato, 2013). The goal of this project (NSF 2023210) is to quantify eddy heat fluxes across the southern ACC, warming waters around the Antarctica, using a) direct observations in an area at the Southeast Indian Ridge (SEIR, red box in Figure 1), where major ACC fronts converge closely together and exhibit strong eddy variability in the lee of the ridge complex, and b) a global eddying HYCOM simulation that represent well the structure of the ACC (Xu et al., 2020) and Atlantic meridional overturning circulation in the South Atlantic Ocean (Xu et al., 2022).
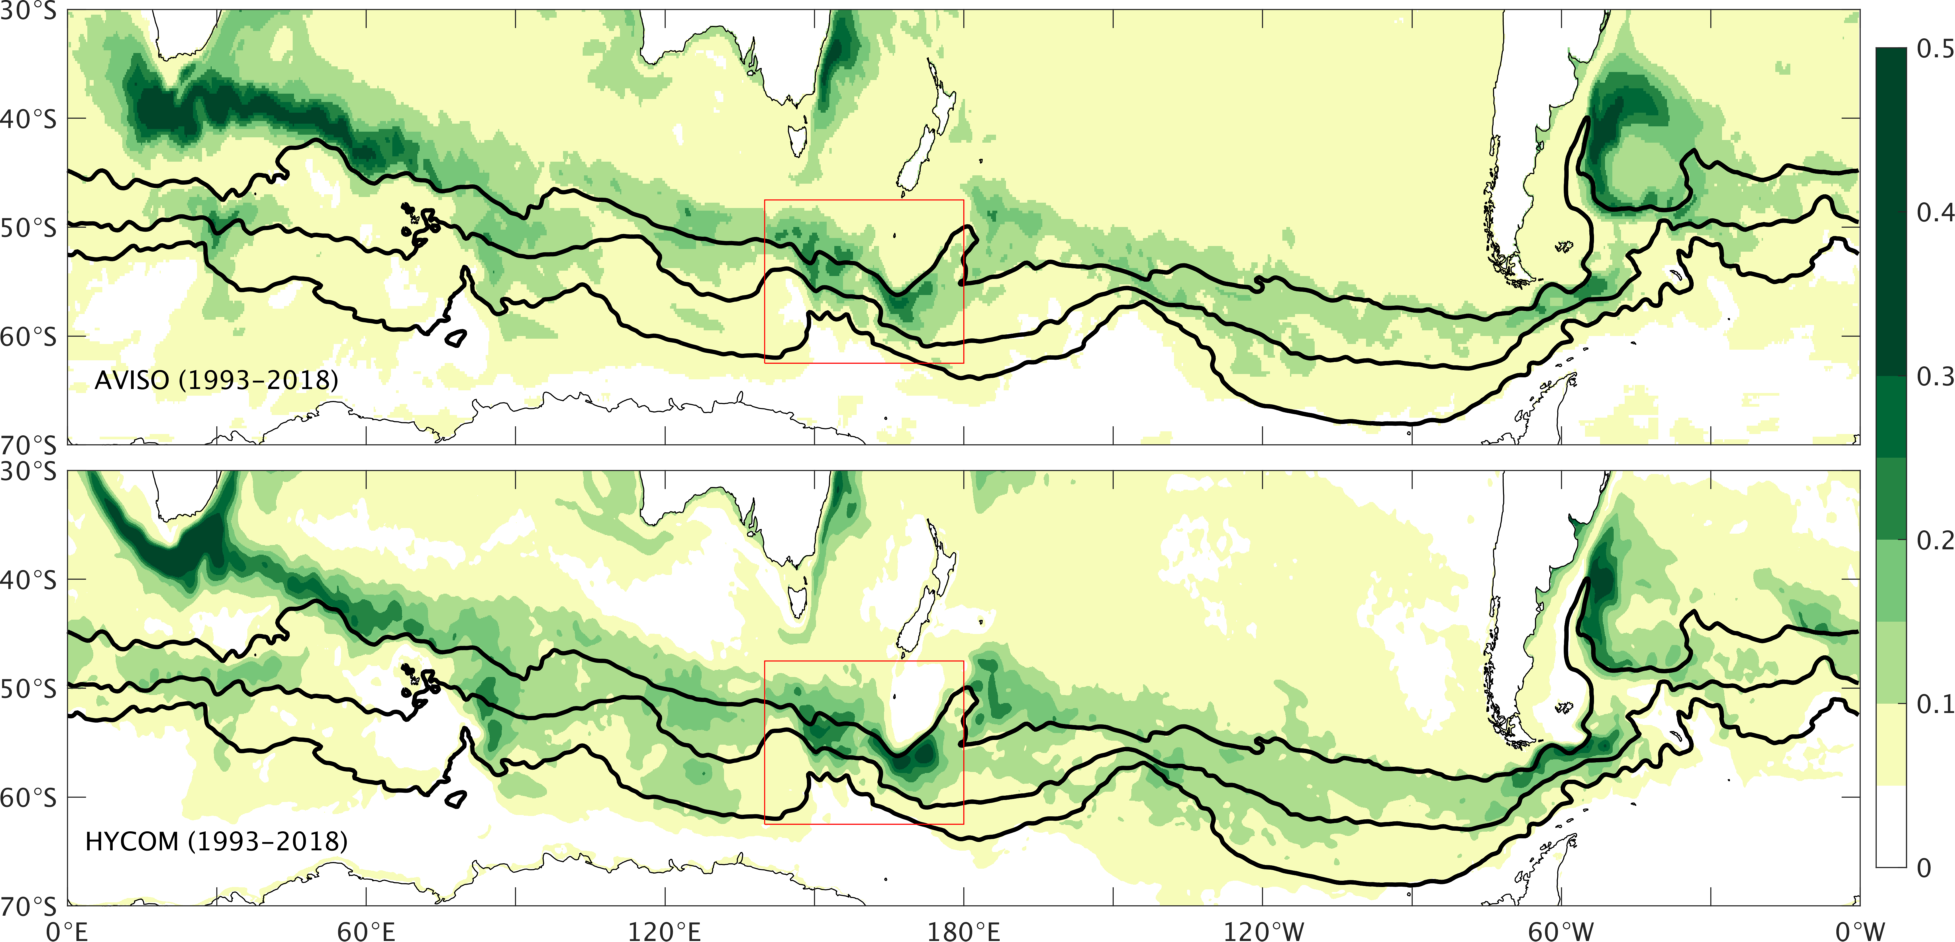 Figure 1: Sea surface height (SSH) standard deviation from satellite (top) and 1/12° global
HYCOM (bottom) for the period of 1993-2018. The SIER system is outlined in red rectangle.
Figure 1: Sea surface height (SSH) standard deviation from satellite (top) and 1/12° global
HYCOM (bottom) for the period of 1993-2018. The SIER system is outlined in red rectangle.
Research Highlights
The circulation near SEIR represented in global HYCOM simulation.We examine the capability and limitation of the 1/12° global HYCOM simulation without data- assimilation in representing the structure of the mean circulation pattern, i.e., ACC fronts in the SEIR region, such that one can place the observations into a larger scale/longer term context (if the model can represent the basic feature of the circulation observed). Figure 2 compares directly the 11-month mean bottom current from the SEIR array and from the model simulation. The time averaged current is predominantly southward, corresponding to the southward steering of the ACC front (that can be seen in sea surface height). If one examines closely, there is also a clockwise rotation of the current vector as a function of the depth (more southward flow toward bottom). Despite this subtle rotation, there is still a significant barotropic component of the velocity, so that there is a similar variability from top to bottom. These observations and model results are used to examine the dynamics of eddy fluxes across the ACC fronts (Exley et al., 2026)
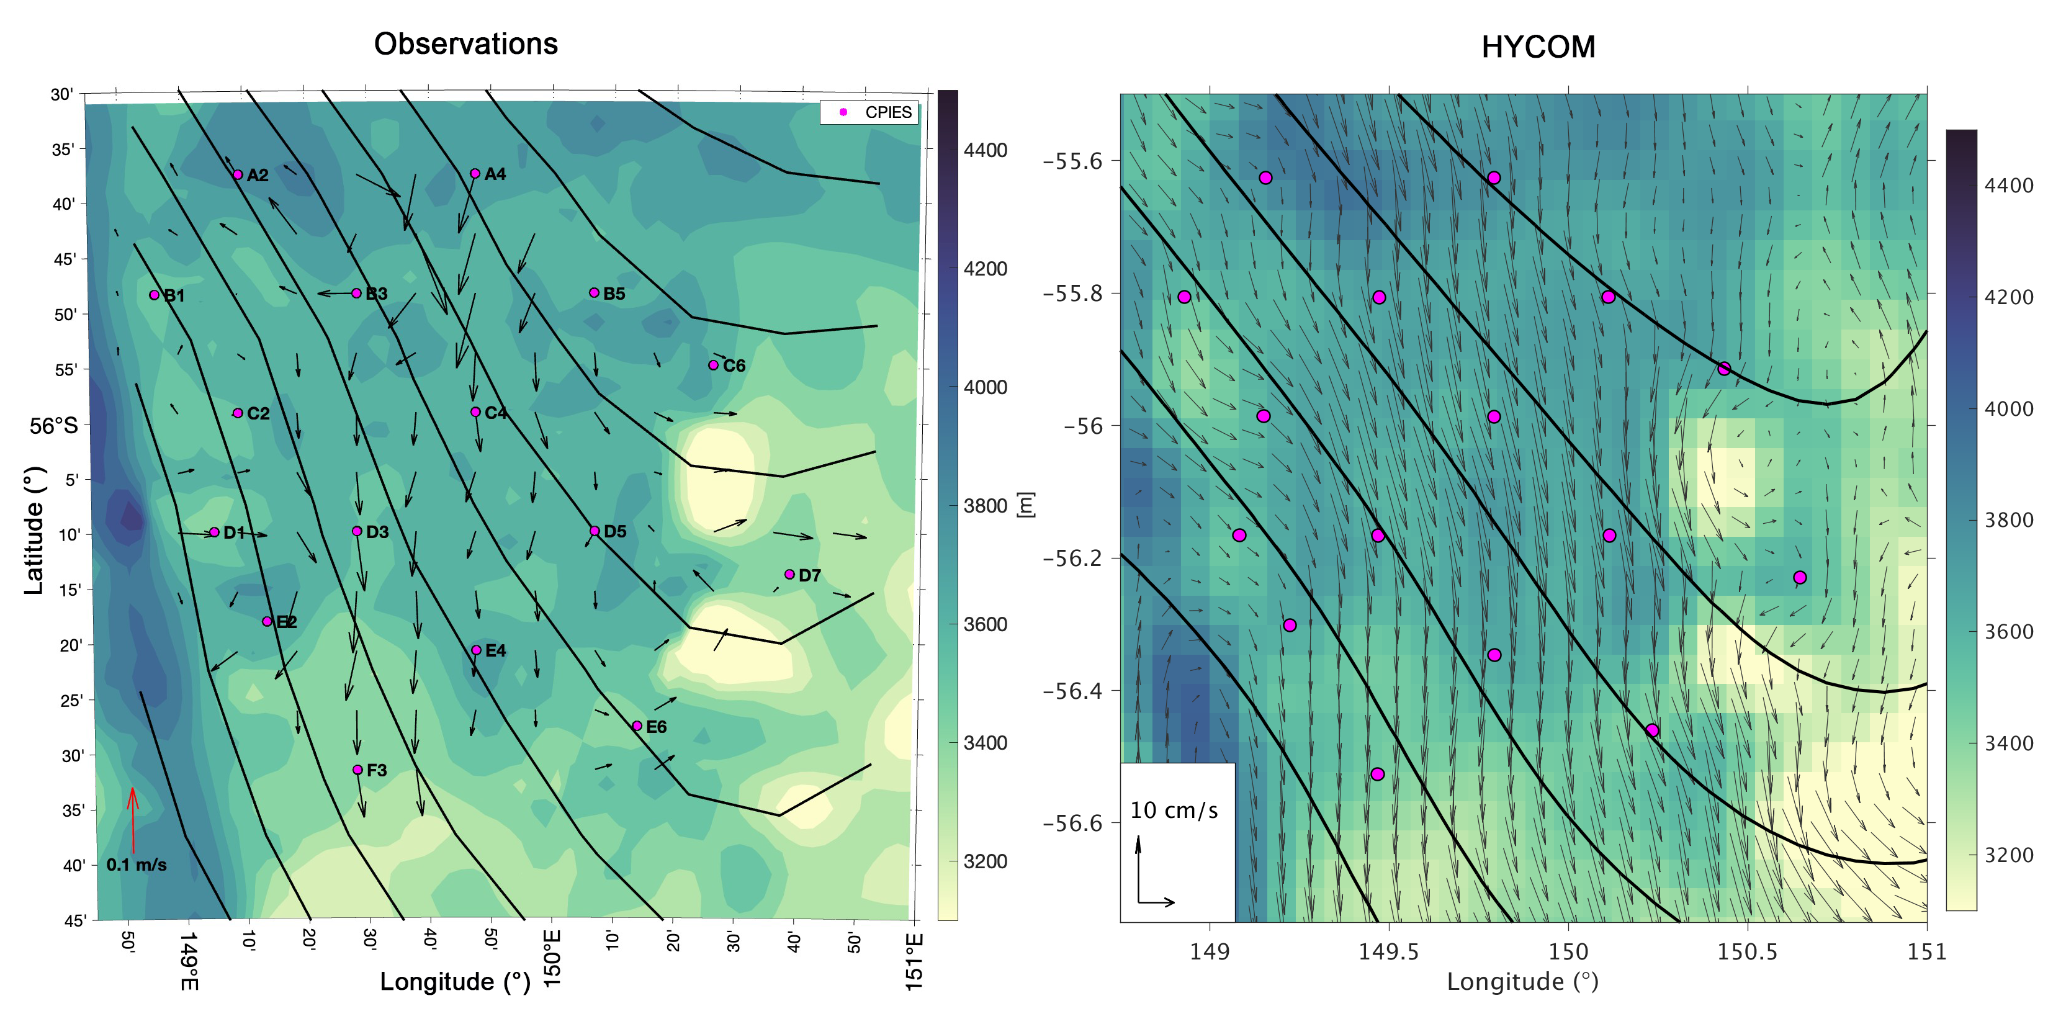 Figure 2: A direct comparison of the time averaged near-bottom current derived from
(left) CPIES array observations and (right) global HYCOM simulation over the same
observation period (of 2021/11/01-2022/09/29). The black contours are SSH indicating
a general southeast flow over this period (as compared to generally southward flow
near the bottom). Pink dots denote the location of the SEIR CPIES array.
Figure 2: A direct comparison of the time averaged near-bottom current derived from
(left) CPIES array observations and (right) global HYCOM simulation over the same
observation period (of 2021/11/01-2022/09/29). The black contours are SSH indicating
a general southeast flow over this period (as compared to generally southward flow
near the bottom). Pink dots denote the location of the SEIR CPIES array.
Heat budget of the Southern Ocean and meridional heat transports.Heat budget of the Southern Ocean and the oceanic meridional heat transport (MHT) due to time mean flow and eddy variability are displayed in Figure 3 and 4, respectively. The heat budget show that in the Southern Ocean, the heat balance between oceanic heat transport and air-sea heat flux. The ocean heat transport is contributed both from the time mean flow and temporal variability. The relative importance between these two components varies significantly across different latitudes, from ~20% near 54°S to over 90% near 38°S. The time mean flow contribution is primarily from standing eddy, whereas the variability contribution is from the transient eddy. High “localized” transient eddy contributions are found in three key regions: the Brazil-Malvinas confluence in the South Atlantic, near 85°E in the Indian Ocean, and south of Australia (near 145°E) and New Zealand (near 175°E).
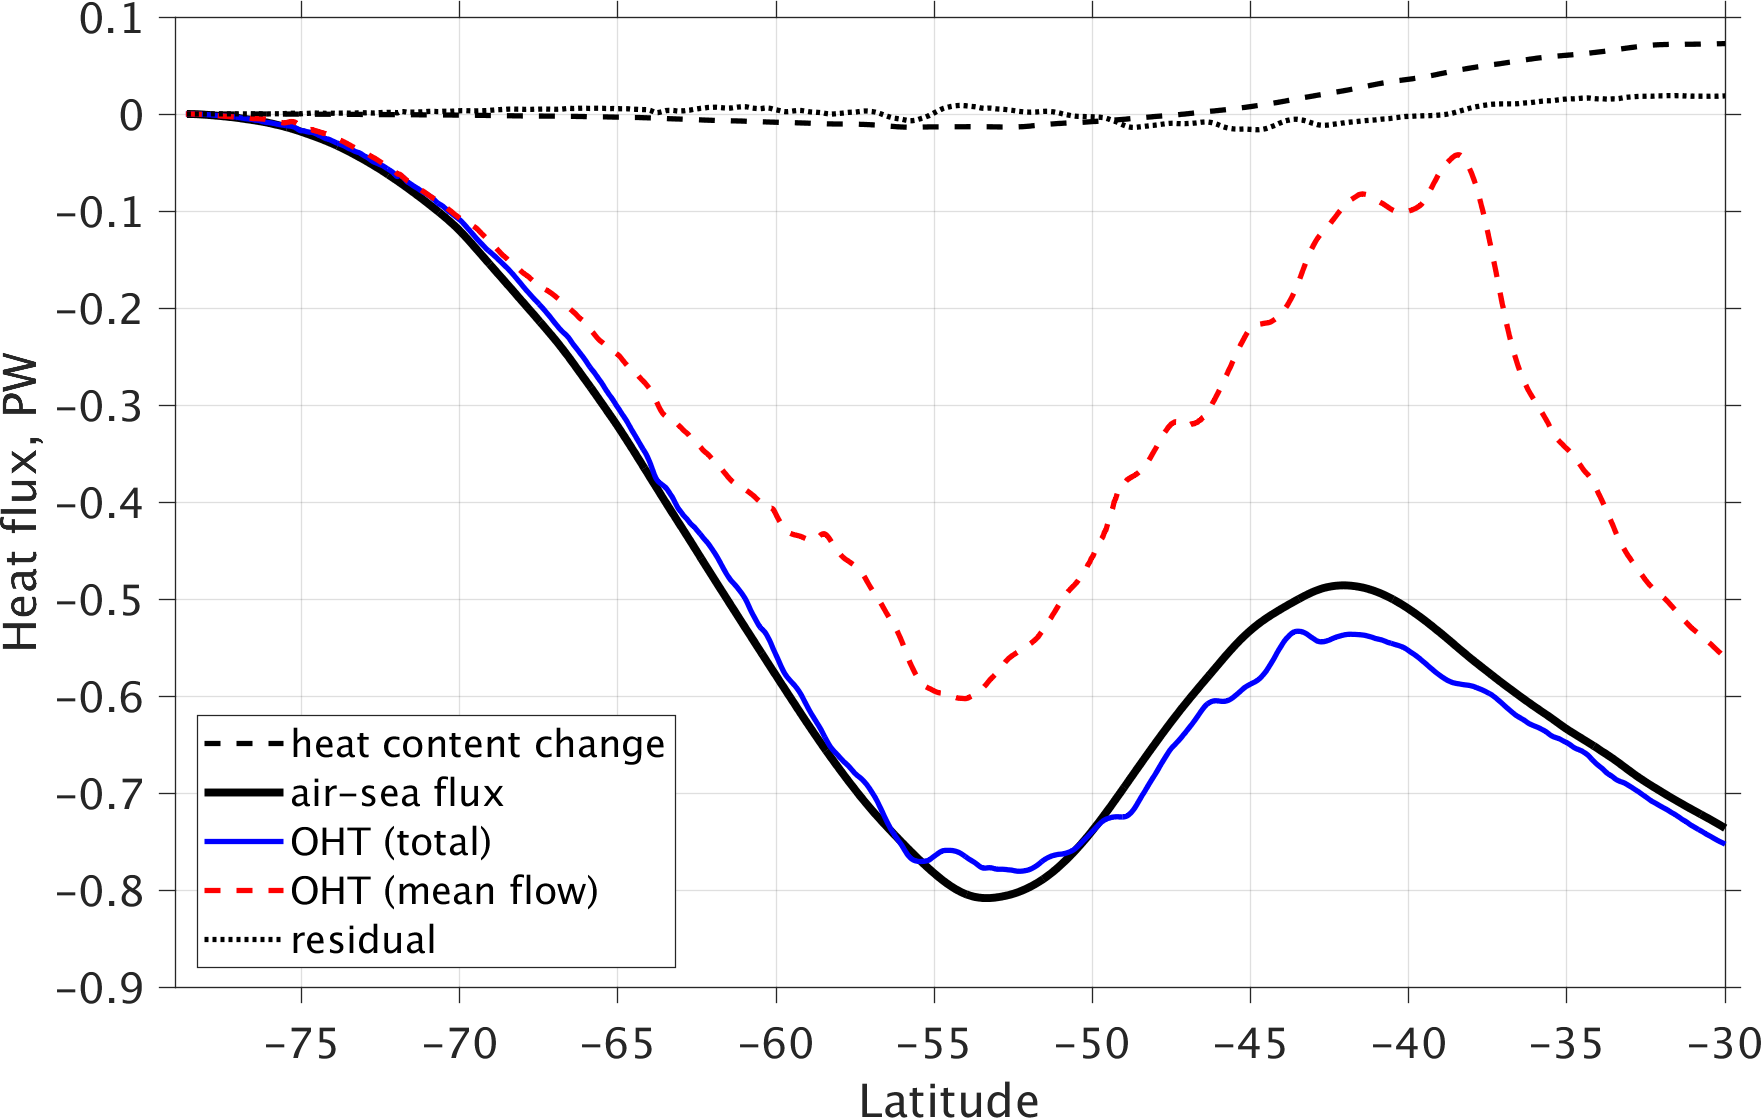 Figure 3: Heat budget of the Southern Ocean from 1/12 global HYCOM simulation over
1993-2023. Solid black line is air-sea flux, solid blue line is the ocean heat transport
(OHT), dashed black line is heat content change, dashed red line is OHT due to time
mean flow (standing eddy), and dotted black line is the residual (between heat content
change, air-sea flux, and OHT).
Figure 3: Heat budget of the Southern Ocean from 1/12 global HYCOM simulation over
1993-2023. Solid black line is air-sea flux, solid blue line is the ocean heat transport
(OHT), dashed black line is heat content change, dashed red line is OHT due to time
mean flow (standing eddy), and dotted black line is the residual (between heat content
change, air-sea flux, and OHT).
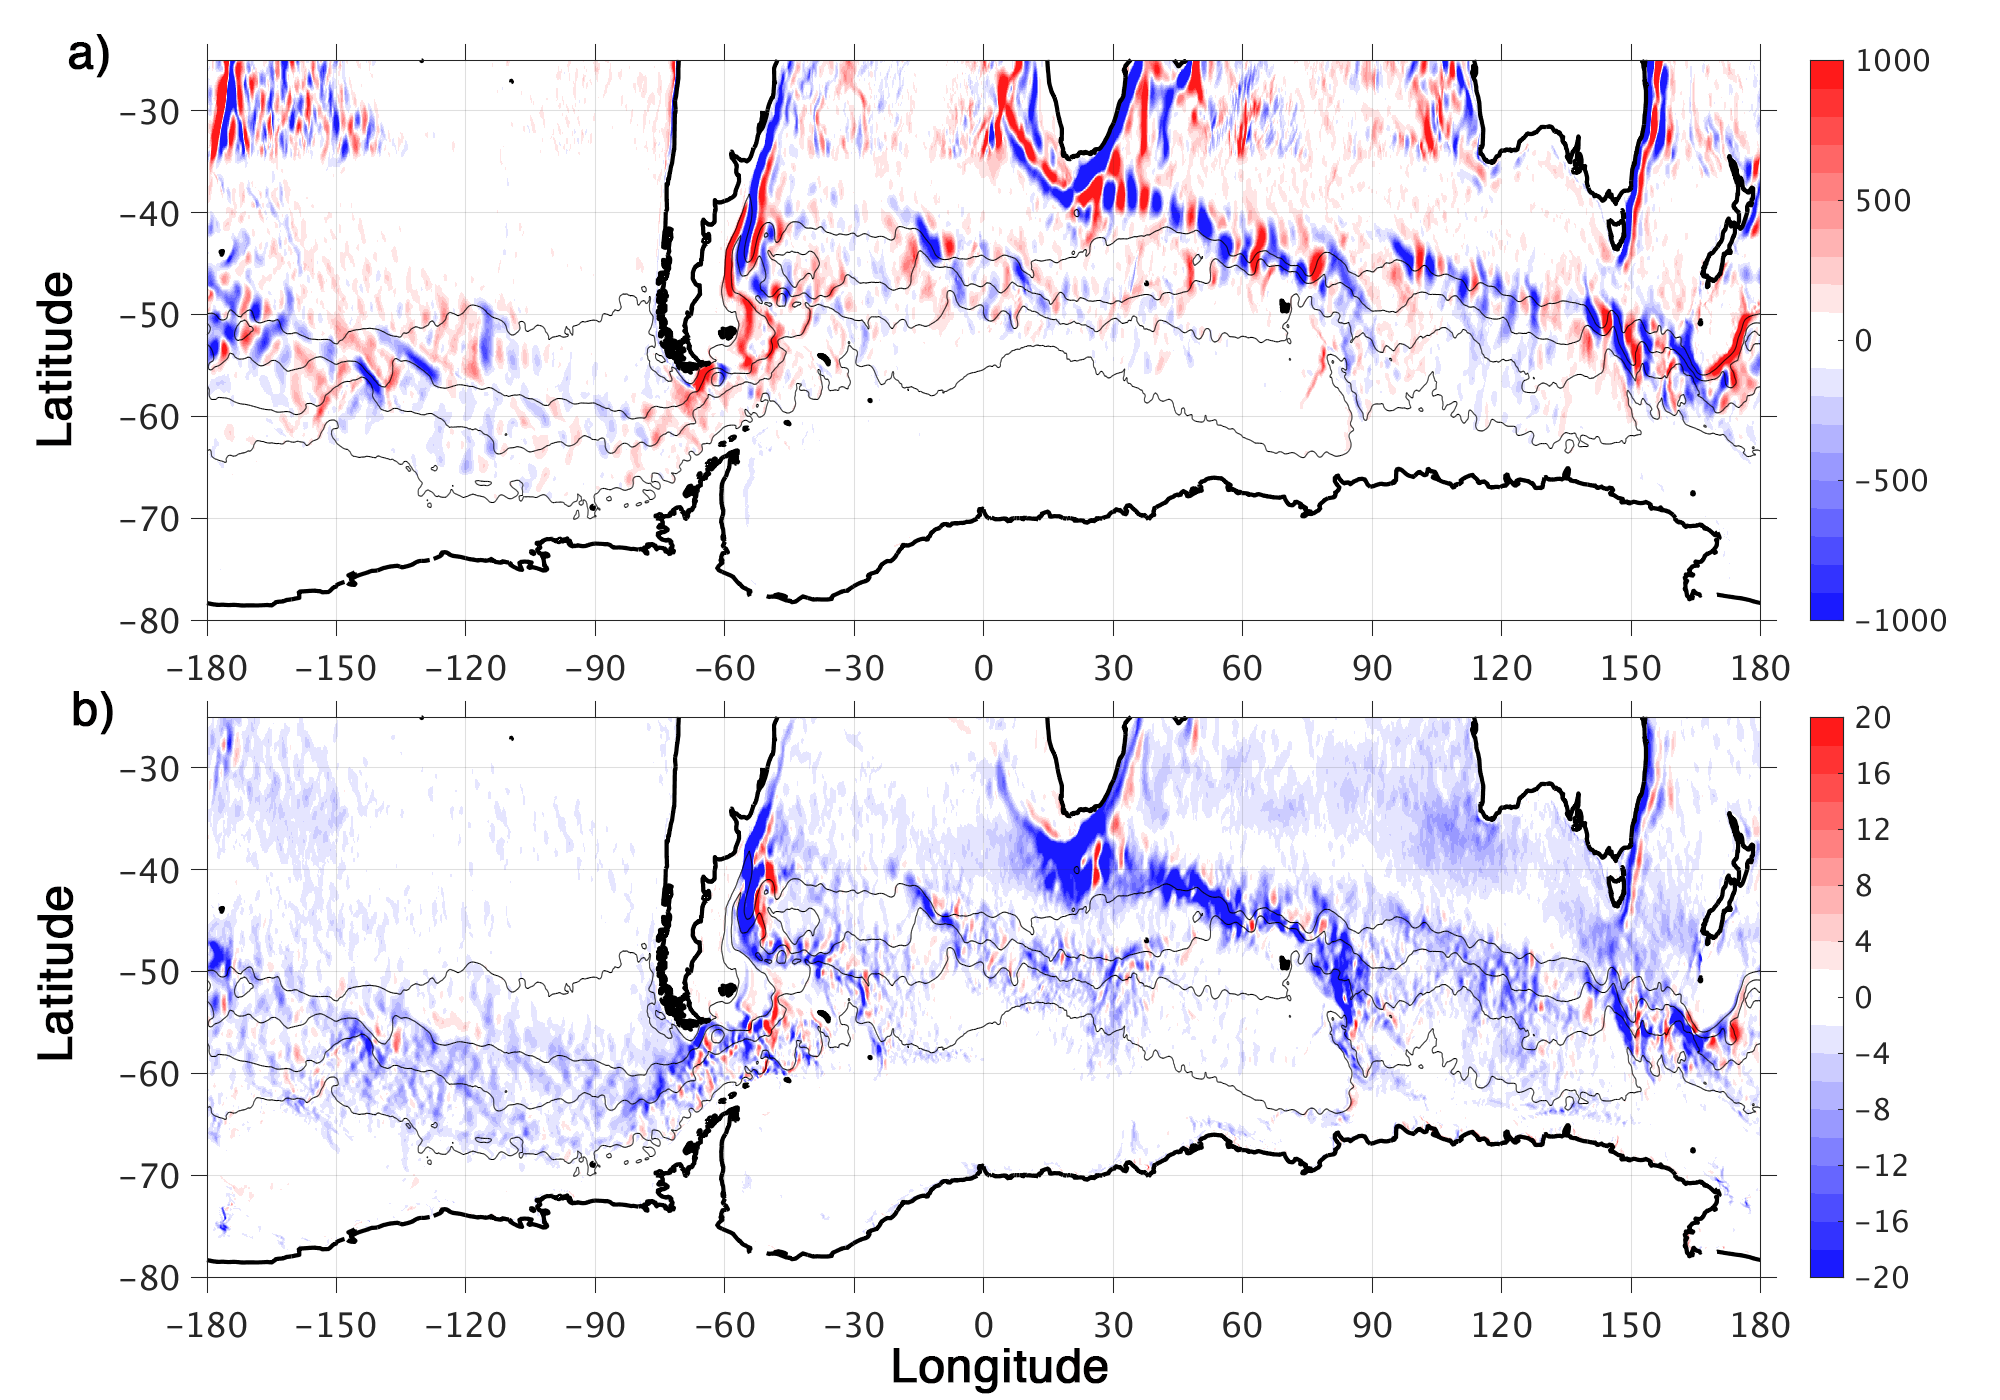 Figure 4:Spatial distribution of OHT due to a) time mean flow, and b) eddy variability.
Data availability
The original global HYCOM outputs are large and are stored in the ERDC archive
server and some of key the model results are available in HYCOM server
(https://data.hycom.org/pub/xbxu/GLBb0.08/SEIR). Further inquiries of the model
outputs can be directed to the PI of the project
References
Foppert, A., K. A. Donohue, D. R. Watts, and K. L. Tracey (2017), Eddy heat flux across the Antarctic Circumpolar Current estimated from sea surface height standard deviation, J. Geophys.Res. Oceans, 122, 6947–6964, doi:10.1002/2017JC012837.
Rintoul, S. R., and A. C. Naveira Garabato (2013), Dynamics of the Southern Ocean circulation, in Ocean Circulation and Climate - A 21st Century Perspective, International Geophysics Ser., vol. 103, edited by G. Siedler, S. M. Griffies, J. Gould, and J. A. Church, pp. 471–492, Elseveir, NY, doi:10.1016/B978-0-12-391851-2.00018-0.
Sokolov, S., and S. Rintoul (2009), The circumpolar structure and distribution of the Antarctic Circumpolar Current fronts. Part 1: mean circumpolar paths, J. Geophys. Res., 114, C11,018, doi:10.1029/2008JC005108
Tamsitt, V., R. P. Abernathey, M. R. Mazloff, J. Wang, and L. D. Talley (2018), Transformation of deep water masses along Lagrangian upwelling pathways in the Southern Ocean, J. Geophys. Res. Oceans, 123, 1994–2017, doi:10.1002/2017/JC013409.
Tamsitt, V., et al. (2017), Spiraling pathways of global deep waters to the surface of the Southern Ocean, Nat. Commun., 8, 172, doi:10.1038/241467-017-00197-0.
Thompson, A. F., and J.-B. Sall´ee (2012), Jets and topography: Jet transitions and the impact on transport in the Antarctic Circumpolar Current, J. Phys. Oceanogr., 42, 956–972.
Watts, D. R., K. L. Tracey, and K. A. Donohue (2018), Role of the Antarctic Circumpolar Current standing meanders in the downstream evolution of thermohaline properties, 2018 Ocean Sciences Meeting, abstract PL53C-03.
Xu, X., E. P. Chassignet, Y. L. Firing, and K. Donohue, 2020, Antarctic Circumpolar Current transport through Drake Passage: What can we learn from comparing high-resolution model results to observations? J. Geophys. Res. Oceans, 125, e2020JC016365, doi:10.1029/2020JC016365
Xu, X., E. P. Chassignet, S. Dong, and M. O. Baringer, 2022, Transport structure of the South Atlantic Ocean derived from a high-resolution numerical model and observations, Front. Mar. Sci., 9:811398. doi:10.3389/fmars.2022.811398.
Exley, A. J., K. Donohue, and X. Xu, 2026, Dynamics of the southern Indian Ridge storm strack evaluated using a wave activity flux framwork, Journal of Physical Oceanography, accepted.