
Background
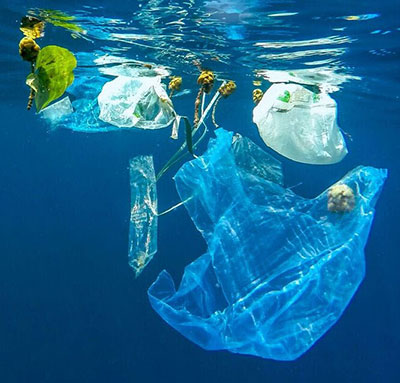
Litter is found in all the world's oceans and seas, even in remote areas far from human contact due to its transboundary nature. The continuous growth in the amount of solid waste thrown away and the slow rate of degradation of most items are together leading to a gradual increase in marine litter found at sea, on the sea floor and coastal shores. It has become an economic, environmental, human health and aesthetic problem posing a complex and multi-dimensional challenge.
Marine litter results from human behavior, whether accidental or intentional. 80% of marine litter comes from land sources and plastics are the most abundant type. It includes wastes released from dumpsites near the coast or river banks, the littering of beaches, tourism and recreational use of the coasts, fishing industry activities and ship-breaking yards. The major sea-based sources include, abandoned, lost, or discarded fishing gear, shipping activities and both legal and illegal dumping.
The factors determining the transport and fate of the debris are its size and its buoyancy. Land-based sources are considered the dominant input of plastics into the ocean. It is roughly estimated that 80% of the marine debris originates from mismanaged waste on land. In 2016, the global production of plastics was approximately 330 million metric tonnes (Mt) (Plastics Europe, 2017) and it is estimated to double within the next 20 years (Lebreton and Andrady, 2019). Mismanaged plastic waste (MPW) is defined as plastic material littered, ill-disposed, or from uncontrolled landfills. Through runoff, winds, and gravity, plastic debris enters the sea from the coastal environment (Jambeck et al., 2015) and via rivers (Lebreton et al., 2017). There are however few direct measurements of plastic entering the ocean and one has to rely on conceptual frameworks (Jambeck et al., 2015; Lebreton et al., 2017; Schmidt et al., 2017; Lebreton and Andrady, 2019) to compute, from the best available data, an order-of-magnitude estimate of the amount of MPW entering the world ocean. The main sources of uncertainties are from the relatively few measurements of waste generation, characterization, collection, and disposal, especially outside of urban centers (Jambeck et al., 2015).
The United Nations Environment Assembly (UNEA) has recognized marine litter as one of the top priorities through its three resolutions (from UNEA-1 in 2014 and UNEA-2 in 2016, UNEA-3 in 2017, amd UNEA-4 in 2019) specifically calling for actions to combat marine litter. Marine litter has also been recognized in Sustainable Development Goal 14, and its targets and indicators.
Description of the Model
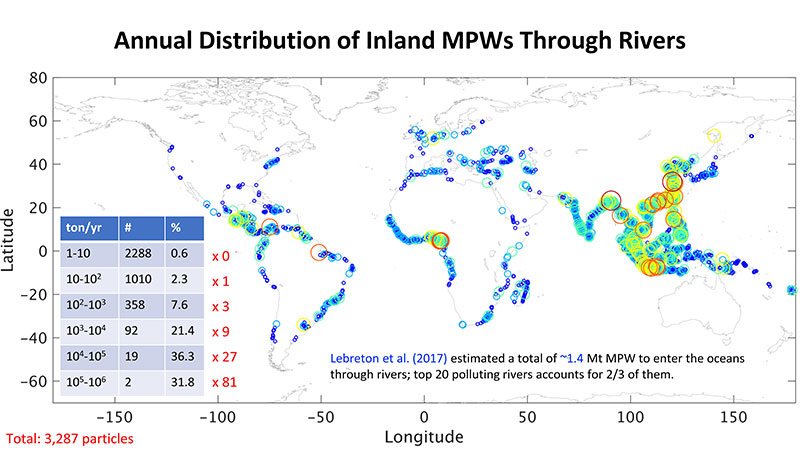
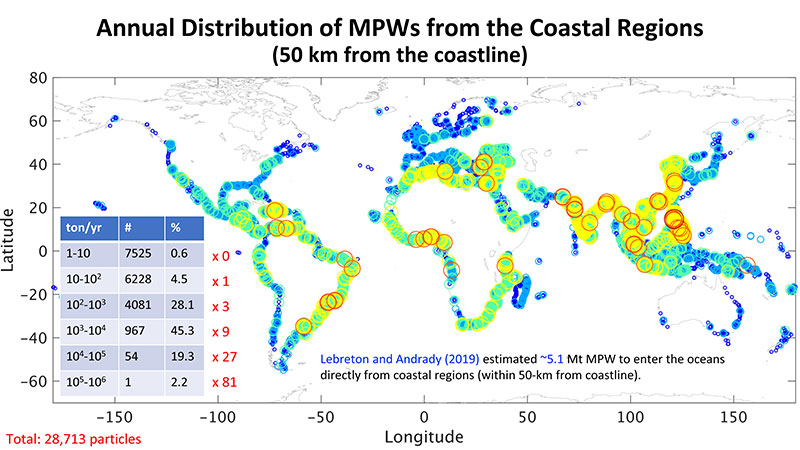
In the World's Ocean Litter Model, Chassignet et al. (2021) we use is OceanParcels v2.0, a state-of-the-art Lagrangian Ocean analysis framework (Delandmeter and van Sebille, 2019) to create customizable particle tracking simulation using outputs from ocean circulation models. The ocean circulation model outputs used in OceanParcels are from the GOFS3.1, a global ocean forecast system based on the HYbrid Coordinate Ocean Model (HYCOM) and the Navy Coupled Ocean Data Assimilation (NCODA) (Chassignet et al., 2009; Metzger et al., 2014). As illustrated below, we derived MPW inputs for the model using Lebreton and Andrady (2019) for the coastal regions (within 50 km from the coastline) and Lebreton et al. (2017) for the inland regions via rivers. For a full description of the model and its results, the reader is referred to Chassignet et al. (2021).
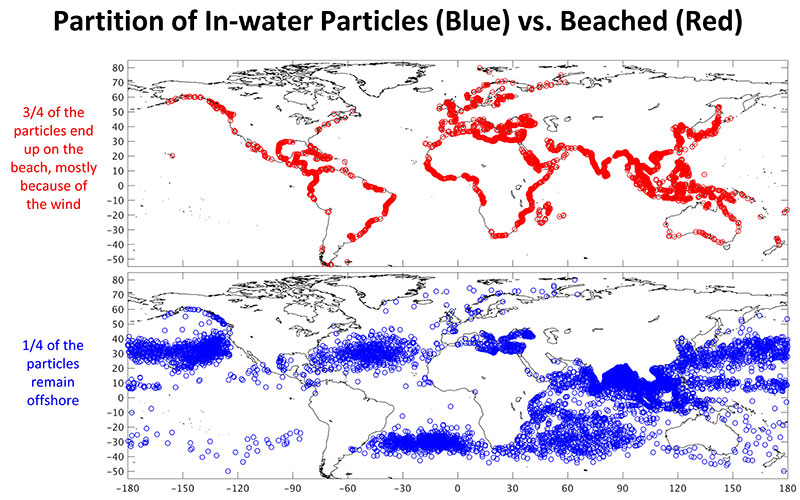
In addition to ocean currents, marine litter is subjected to wind drift and Stokes drift. To take these effects into account, we add 1% of the wind speed with no deflection angle. A small random walk is also added to represent the small-scale processes that are not resolved by the ocean model grid. With the addition of wind, the marine litter can be advected over land and beaches. The figure below displays the partition on particles on the beach versus the particles that remain in the water. A large number (3/4) ends up on the beach over a five-year period; only a quarter remains offshore. Not all the plastics remain at the surface of the water and some will sink to the bottom: 40% of the plastic produced is denser than seawater (Andrady, 2011). This is taken into account when seeding the particles.
Visualizing the Results
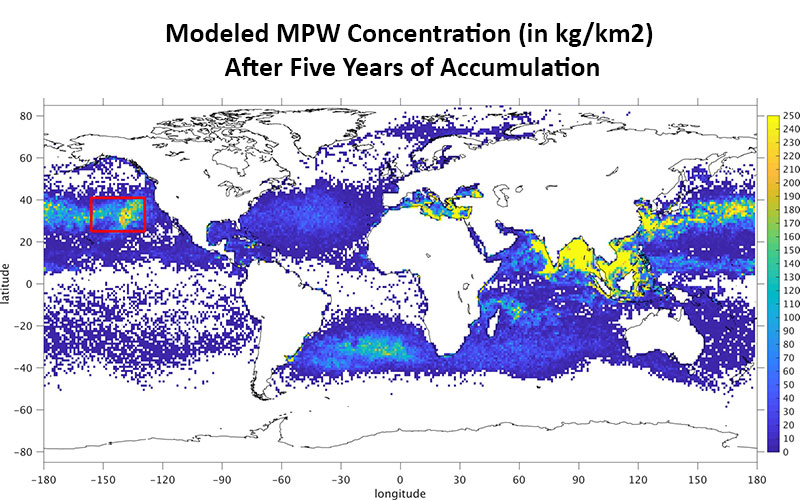
The figure below displays the modeled mismanaged plastic waste (MPW) concentration (in kg/km2) after five years of accumulation. The red box indicates Great Pacific Garbage Patch.
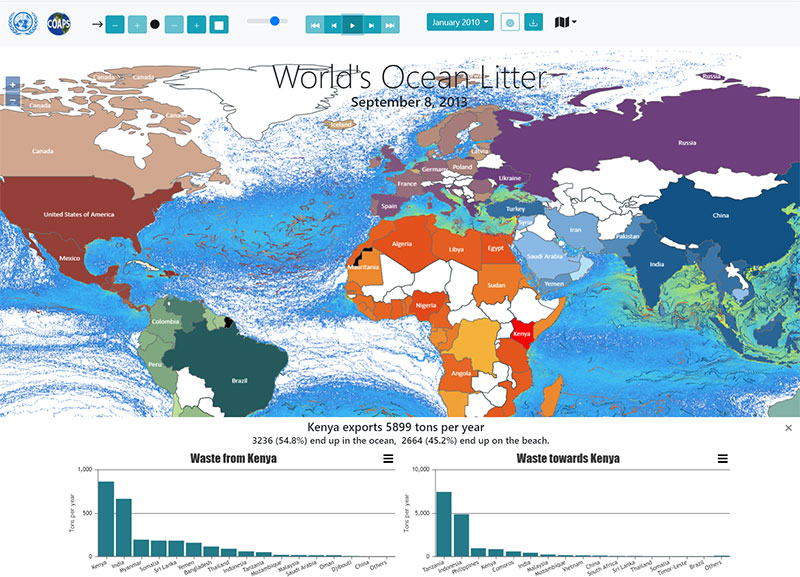
The modeled MPW can be seen via an online interface that provides a dynamic display of the particle trajectories and statistics by country. The screenshot below of the web interface shows statistics for Kenya.
This Global Model for Monitoring Marine Litter was developed in support of the United Nations Environment Assembly (UNEA) Resolutions on Marine Litter and Microplastics, in particular the components related to developing national inventories of marine plastic sources, pathways, and accumulation spots, through the Global Programme of Action on the Protection of the Marine Environment from Land-based Activities and the Global Partnership on Marine Litter. The main questions addressed with the model are:
- Where does the MPW released in the ocean by a given country go?
- Where does the MPW found on the coastline of a given country come from?
In addition to the Global Model for Monitoring Marine Litter data visualization, statistics for all the world countries are available in a series of tables that can be downloaded as pdf, csv, or json.
Future Directions
The most difficult aspect of this work obtaining observations that can be used to validate the global model. These observations are very limited as it is extremely difficult to quantify the amount of plastic found on beaches (which are often remote) and to ascertain any information on its origin. For example, the numerical results are consistent with data collected in Kenya during the National Marine Litter Data Collection Training (13-22 August 2019) provided by Peter Ryan to Jillian Campbell (UN). Out of 1,819 bottles found on the Kenyan beaches during the National Marine Litter Data Collection Training, approximately 2/3 (1,227) were determined to be local and from Kenya. For those identified as coming from countries outside of Kenya, the two countries that contributed the most were Tanzania (98) and Indonesia (86), the same two countries that contribute most of the ocean MPW in our global model. Similar measurements should be performed for other countries. Furthermore, there are many uncertainties (plastic life cycle, size, small scale flow features, etc.) associated with these results, but they provide a first order assessment of the beached MPW sources. Chassignet et al. (2021).
Acknowledgments
The work was supported by the United Nations Environment Program (UNEP) small scale funding agreements SSFA/2019/1345 and SSFA/2020/2665.
References
Andrady, A.L., 2011. Microplastics in the marine environment. Mar Pollut Bull, 62(8):1596–1605
Chassignet, E.P., H.E. Hurlburt, E.J. Metzger, O.M. Smedstad, J. Cummings, G.R. Halliwell, R. Bleck, R. Baraille, A.J. Wallcraft, C. Lozano, H.L. Tolman, A. Srinivasan, S. Hankin, P. Cornillon, R. Weisberg, A. Barth, R. He, F. Werner, and J. Wilkin, 2009. U.S. GODAE: Global Ocean Prediction with the HYbrid Coordinate Ocean Model (HYCOM). Oceanography, 22(2), 64-75.
Chassignet, E.P., X. Xu, and O. Zavala-Romero, 2021. Tracking marine litter with a global model: Where does it go? Where does it come from? Front. Mar. Sci., 8:414, doi:10.3389/fmars.2021.667591.
Delandmeter, P., and E. van Sebille, 2019: The Parcels v2.0 Lagrangian framework: new field interpolation schemes, Geoscientific Model Development, 12, 3571-3584.
Jambeck, J.R., R. Geyer, C. Wilcox, T.R. Siegler, M. Perryman, A.L. Andrady, et al., 2015: Plastic waste inputs from land into the ocean, Science, 347, 768–771.
Lebreton, L.C.M. et al., 2017. River plastic emissions to the world’s oceans. Nat. Commun., 8, 15611. doi: 10.1038/ncomms15611.
Lebreton, L., and Andrady, A., 2019. Future scenarios of global plastic waste generation and disposal. Palgrave Commun 5, 6. https://doi.org/10.1057/s41599-018-0212-7
Metzger, E.J., O.M. Smedstad, P.G. Thoppil, H.E. Hurlburt, J.A. Cummings, A.J. Wallcraft, L. Zamudio, D.S. Franklin, P.G. Posey, M.W. Phelps, P.J. Hogan, F.L. Bub, and C.J. DeHaan. 2014. US Navy operational global ocean and Arctic ice prediction systems. Oceanography, 27(3), 32–43.
Schmidt C., Krauth T., Wagner S., 2017. Export of plastic debris by rivers into the sea. Environ Sci Technol, 51(21):12246–12253
Van Sebille, E.; Law, Maximenko, Alsina, Bagaev, Bergmann, Chapron, Chubarenko, Cózar, Delandmeter, Egger, Fox-Kemper, Garaba, Goddijn-Murphy, Hardesty, Hoffman, Isobe, Jongedijk, Kaandorp, Khatmullina, Koelmans, Kukulka, Laufkötter, Lebreton, Lobelle, Maes, Martinez-Vicente, Morales Maqueda, Poulain-Zarcos, Rodríguez, Ryan, Shanks, Shim, Suaria, Thiel, van den Bremer, and Wichmann, 2020. The physical oceanography of the transport of floating marine debris. Environmental Research Letters, 15, 023003.